Popgun Bar PatternI created this script to research the trading effectiveness of the Popgun Bar Pattern.
The Popgun Bar Pattern is found when 3 candlesticks in order form the following pattern:
0. Any bar that is then followed by:
1. An inside bar. This is a bar that is completely engulfed by the bar before it. It will have a lower high and a higher low than the previous bar.
2. An outside bar immediately after. This is a bar that completely engulfs the prior inside bar. It will have a higher high and a lower low than the previous bar.
Simply put, the Popgun Bar Pattern is an inside bar followed by an outside bar.
I would highly recommend incorporating this signal as a "trigger" for existing technical analysis. Used in isolation it may not have a high probability of success.
To make it more effective as a trigger to a trading signal I incorporated into my code an Entry, Stop, and a Target dot.
The Entry dot is offset from the low of a bearish Popgun Bar Pattern or the high of a bullish Popgun Bar Pattern by a factor of ATR. The default ATR percentage is 33% but can be adjusted.
The Stop dot is based on the recent highest high (bearish) or lowest low (bullish) of a set range (default is 9 bars) plus/minus the ATR percentage buffer.
The Target dot is automatically calculated from the entry based on a configurable reward factor (default is 3) from the entry to stop distance. This projects a potential 3:1 reward/risk trade by default.
There is an additional alert condition which can be configured at the end of the script.
Search in scripts for "inside bar"

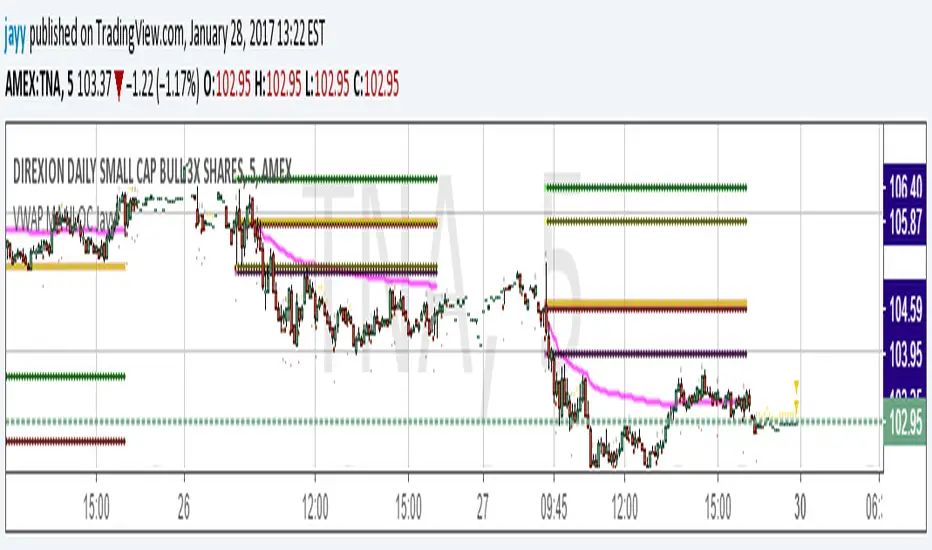
VWAP MA HLOC securities Jayy update fix This version replaces previous versions that stopped functioning as a result of a TradingView script update.
This script complies with the current script syntax.
for intraday securities default is 9:30 am to 4 pm Eastern Other session choices are provided in the format dialogue box.
script plots VWAP, yesterday's high, low, open and close (HLOC), the day befores HLOC - if desired, today's open and todays high and low.
Also signals inside bars (high is less than or equal to the previous
bar's high and the low is greater than or equal to
the previous low) the : true inside bars have a maroon triangle below the bar as well as a ">" above the bar.
If subsequent bars are inside the last bar before the last true inside bar they also are marked with an ">"
Also plots the 20 ema for different time periods (as per Al Brooks), If you trade the 5 min then you will
likely be interested in the 20 ema for 15 mins and 60 mins
the following is a list of the higher timeframe 20 emas
1 minute 5, 15, 60 period 20 ema
5 minute 15, 60 period 20 ema
15 minute 60, 120 , 240 period 20 ema
60 minute 120, 240 period 20 ema
120 minute 240, D period 20 ema
240 minute D period 20 ema
Jayy
VWAP forex Yesterday Hi/Low switchThis script plots VWAP, yesterday's high, low, open and close (HLOC), the day before's HLOC -
Also plots higher timeframe 20 emas including:
1 minute 5, 15, 60 period 20 ema
5 minute 15, 60 period 20 ema
15 minute 60, 120 , 240 period 20 ema
60 minute 120, 240 period 20 ema
120 minute 240, D period 20 ema
240 minute D period 20 ema
Also signals inside bars (high is less than or equal to the previous
bar's high and the low is greater than or equal to the previous low) the : true inside bars have a maroon triangle below the bar as well as a ">" above the bar.
If subsequent bars are inside the last bar before the last true inside bar they also are marked with an ">"
If you have suggestions let me know.
Jayy

VWAP MA HLOC JAyy
For intraday 9:30 to 4 pm Eastern plots VWAP, yesterday's high, low, open and close (HLOC), the day before HLOC - if desired, today's open and today's high and low.
Also signals inside bars (high is less than or equal to the previous bar's high and the low is greater than or equal to
the previous low) the : true inside bars have a maroon triangle below the bar as well as a ">" above the bar.
If subsequent bars are inside the last bar before the last true inside bar they also are marked with an ">"
Also plots the 20 ema for different periods, If you trade the 5 min then you will likely be interested in the 20 ema for 15 mins and 60 mins

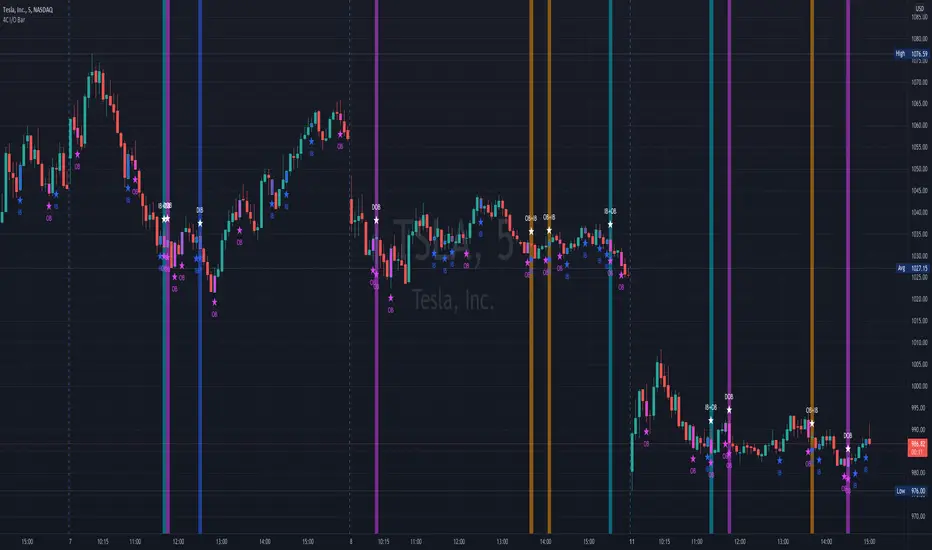
Double Inside Body Candles with Box & Alert + 5-Bar LinesThis indicator identifies Double Inside Body Candle patterns, where:
Candle 1 is completely inside Candle 2,
Candle 2 is completely inside Candle 3 (the parent candle),
Candle 3 has a real body (not a doji or negligible body size).
Once the pattern is detected:
A label appears below the current candle.
A highlight box is drawn around Candle 3 (the parent candle) body range.
Horizontal lines are drawn from the top and bottom of Candle 3’s body and extend forward for exactly 5 bars to visualize potential breakout levels.
The script also detects and highlights breakouts:
🔼 Bullish breakout: if price closes above Candle 3's body high.
🔽 Bearish breakout: if price closes below Candle 3's body low.
Alerts are available for:
Double Inside Body pattern detection
Bullish breakout
Bearish breakout
Traders can use this script to identify consolidation periods (double inside bars), then monitor for breakout opportunities in either direction, using the 5-bar lines as short-term breakout levels.

Gann Swing PointsIndicator Logic
This is a GANN-style swing indicator that classifies bars based on their high/low structure relative to the previous bar.
I strongly encourage you to replay bars on Tradingview using this indicator to get a sense of how it creates pivot (or swing) points
Bar Classification:
Up-Bar (direction: 'up'): Higher High and Higher Low (HH/HL)
Down-Bar (direction: 'down'): Lower High and Lower Low (LH/LL)
Outside-Bar (generates 2 directions):
Green: 'down' then 'up'
Red: 'up' then 'down'
Inside-Bar: No direction generated (HL/LH)
Swing Line Logic
The swing line continues in the current direction until n opposite directions are detected.
n is the "n-direction" parameter (commonly set to 2, so 2 consecutive opposite direction is needed to turn the swing)
When n opposing directions occur, the swing turns, creating a pivot point
Inside bar is ignored, so e.g up-bar -> inside-bar -> up-bar generates "up", "up" direction
A top pivot is formed when the swing turns down
A bottom pivot is formed when it turns up
Note: This swing logic is inherently lagging — it only confirms tops/bottoms after the fact
This swing structure gives the system a clear and noise-resistant way to identify pivot points (swing-points)

Inside Candle and mother candle range with alert++>>This script allows you the inside bar candle and the cnadle is shown in white.
The range of the mother candle is identified and tracked until it breaks.
Once the first range is over ridden then the next similar pattern will be occured and the tracking will be done for the mother candle latest occurrence.
It also has the alert mechanism where you can go and the alert for the indicator in Alerts.
5 min is the most preferrable time frame and while saving the alert Note to save the time frame of the chart. For which ever time frame is saved the Alert will be triggered for the same .
And when th inside bar is triggered it throws an alert condition. this alert condition has to be configured in your alerts and will be buzzing on the screen.
Oct 20
Release Notes: updated with Mother candle top and bottom lines of previous occurrences and tracks the current latest Inside bar mother candle
Release Notes: this script allows you the inside bar cnadle and the cnadle is shown in white. highlighter is configurable and line colors as well.

4C Inside/Outside BarThis indicator colors the candle body based on whether it closed as an Inside Bar (IB) or an Outside Bar (OB).
Inside and outside bars can be powerful triggers to enter or exit trades from, when price breaks above or below the candle.
The coloring of only the body and not the border of the candle makes it possible to still know whether the candle was bullish/bearish.
This indicator has the unique ability to add/hide labels for each IB and OB.
Small labels are printed on the chart directly below the candle. (See below)
It also has the unique ability to paint the chart background when an IB forms directly after an OB.
This is a special combination of the two, and can also be a powerful signal.
This feature can be turned on/off. (See below)
Thanks to Craig Stine, as some parts of this indicator were adapted from Custom Candle color Inside/Outside candles, Highwave, Star Patt. by Craig_Stine
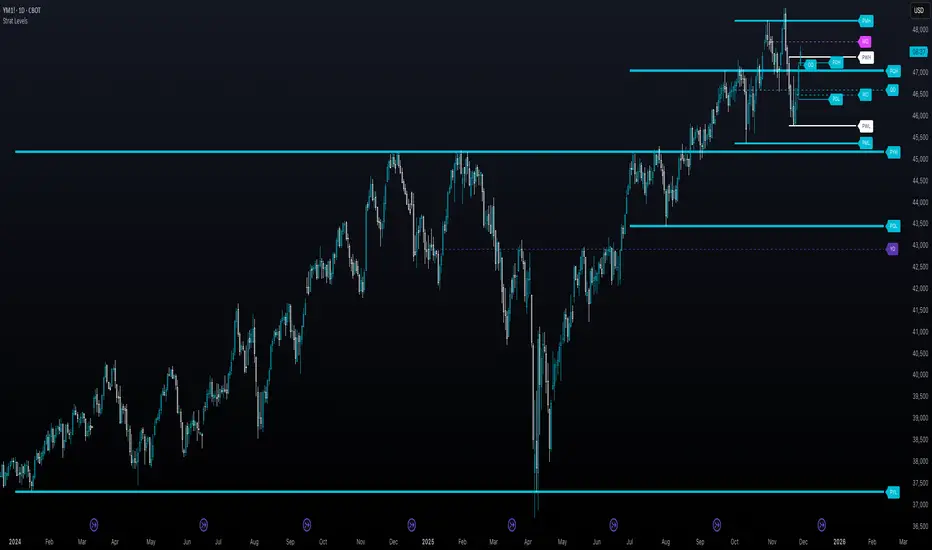
The Strat - Levels [rdjxyz]◆ OVERVIEW
The Strat - Levels dynamically displays key levels used in The Strat trading methodology, developed by Rob Smith. The level colors are dynamically determined by their Strat classification (1, 2 up, failed 2 up, 2 down, failed 2 down, 3)—making it easy to recognize higher timeframe Strat candle classifications from any lower timeframe.
◆ DETAILS
If you're unfamiliar with The Strat, there are 3 universal scenarios regarding candle behavior:
SCENARIO ONE
The 1 Bar - Inside Bar: A candle that doesn't take out the highs or the lows of the previous candle; aka consolidation.
SCENARIO TWO
The 2 Bar - Directional Bar: A candle that takes out one side of the previous candle; aka trending (or at least attempting to trend).
These can be broken down even further as follows:
2 Up: A candle that takes out the high of the previous candle and closes bullish
Failed 2 Up: A candle that takes out the high of the previous candle and closes bearish
2 Down: A candle that takes out the low of the previous candle and closes bearish
Failed 2 Down: A candle that takes out the low of the previous candle and closes bullish
SCENARIO THREE
The 3 Bar - Outside Bar: A candle that takes out both sides of the previous candle; aka broadening formation.
◇ HOW THE DYNAMIC LEVEL COLORING WORKS
PREVIOUS LEVELS
Previous Day High/Low
Previous Week High/Low
Previous Month High/Low
Previous Quarter High/Low
Previous Year High/Low
Each period's levels are compared to their previous period's levels and colored according to the 3 universal scenarios, which are fixed based on historical data. (No repainting)
CURRENT LEVELS
Current Day Open
Current Week Open
Current Month Open
Current Quarter Open
Current Year Open
Each current period's levels (high, low, and current price) are compared to the previous period's levels and current period's open on every tick—changing colors in real-time as their Strat classification changes. (Will repaint as price action evolves)
E.g. When a new day opens inside of the previous day's range (high/low) the Day Open line will be gray (default for inside bars). When the current day trades above the previous day's range, the Day Open line will become aqua (default for 2 up). If price trades back below the current day's open, the Day Open line will become fuchsia (default for failed 2 up). And if price trades below the previous day's range, the Day Open line will become dark purple (default for 3s).
◆ SETTINGS
Current Day Open
Previous Day High/Low
Current Week Open
Previous Week High/Low
Current Month Open
Previous Month High/Low
Current Quarter Open
Previous Quarter High/Low
Current Year Open
Previous Year High/Low
Strat Colors
Each Current Level Open has 4 inputs:
Show/Hide Checkbox
Line Style
Line Width
Label Offset (Integer)
Each Previous Level High/Low has 5 inputs:
Show/Hide High Checkbox
Show/Hide Low Checkbox
Line Style
Line Width
Label Offset (Integer)
And each Strat scenario can be custom colored:
1-Bar Color - Default Gray
2-Up Color - Default Aqua
Failed 2-Up Color - Default Fuchsia
2-Down Color - Default White
Failed 2-Down Color - Default Teal
3-Bar Color - Default Dark Purple
◆ USAGE
There are 3 ways to look at these levels:
Potential continuation (e.g. Previous Day's 2-Up High being broken by Current Day's Price)
Potential reversal (e.g. Previous Day's 2-Down High being broken by Current Day's Price)
Potential exhaustion risk (e.g. Previous Month's Low is broken by Current Day's Price but trades back up into the Previous Month's range)
It's best to use this indicator with a separate indicator that color codes your chart's candles according to their Strat Scenario (1, 2, 3) and use top-down analysis to gauge whether to view levels as a sign of continuation, reversal, or exhaustion risk.
◆ WRAP UP
As demonstrated, The Strat - Levels offers Strat Scenario color-coded key levels, making it easy to identify the previous period's Strat Scenario (1, 2-Up, Failed 2-Up, 2-Down, Failed 2-Down, or 3) without needing to manually plot levels or refer to higher timeframes.
◆ DISCLAIMER
This indicator is a tool for visual analysis and is intended to assist traders who follow The Strat methodology. As with any trading methodology, there's no guarantee of profits; trading involves a high degree of risk and you could lose all of your invested capital. Use of this indicator is not indicative of future results and does not constitute and should not be construed as investment advice. All trading decisions and investments made by you are at your own discretion and risk. Under no circumstances shall the author be liable for any direct, indirect, or incidental damages. You should only risk capital you can afford to lose.
Breakout mode patterns [yohtza]This indicator detects three kinds of price action patterns:
ii - consecutive inside bars ( high and low inside of the previous bar), triangle on a lower timeframe
oo - consecutive outside bars ( high above the high of the previous bar and the low below the low of the previous bar), expanding triangle on a lower timeframe
ioi - inside outside inside, diamond pattern on a lower timeframe
Traders that trade these patterns are entering on breakouts above/below .When they appear in a trending market, they are good setups for both continuation and reversal swing trades. When they appear in ranging market, they are not nearly as powerful since most breakouts fail in this context. To achieve the highest probability, it is best to trade in the direction of the trend on the last bar in the pattern with a stop loss on the other side and going for a reward that is at least twice the risk.

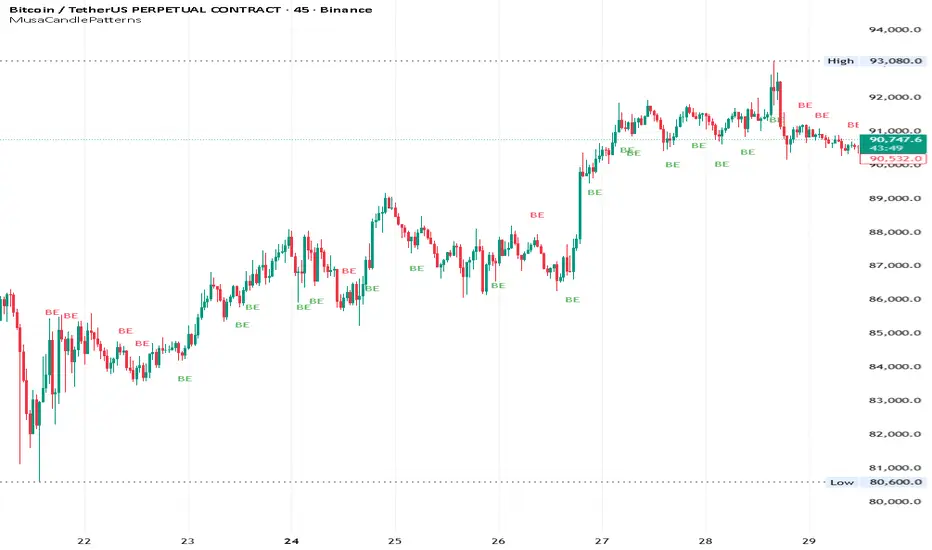
MusaCandlePatternsLibrary "MusaCandlePatterns"
Patterns is a Japanese candlestick pattern recognition Library for developers. Functions here within detect viable setups in a variety of popular patterns. Please note some patterns are without filters such as comparisons to average candle sizing, or trend detection to allow the author more freedom.
doji(dojiSize, dojiWickSize)
Detects "Doji" candle patterns
Parameters:
dojiSize (float) : (float) The relationship of body to candle size (ie. body is 5% of total candle size). Default is 5.0 (5%)
dojiWickSize (float) : (float) Maximum wick size comparative to the opposite wick. (eg. 2 = bottom wick must be less than or equal to 2x the top wick). Default is 2
Returns: (series bool) True when pattern detected
dLab(showLabel, labelColor, textColor)
Produces "Doji" identifier label
Parameters:
showLabel (bool) : (series bool) Shows label when input is true. Default is false
labelColor (color) : (series color) Color of the label border and arrow
textColor (color) : (series color) Text color
Returns: (label) A label visible at the chart level intended for the title pattern
bullEngulf(maxRejectWick, mustEngulfWick)
Detects "Bullish Engulfing" candle patterns
Parameters:
maxRejectWick (float) : (float) Maximum rejection wick size.
The maximum wick size as a percentge of body size allowable for a top wick on the resolution candle of the pattern. 0.0 disables the filter.
eg. 50 allows a top wick half the size of the body. Default is 0% (Disables wick detection).
mustEngulfWick (bool) : (bool) input to only detect setups that close above the high prior effectively engulfing the candle in its entirety. Default is false
Returns: (series bool) True when pattern detected
bewLab(showLabel, labelColor, textColor)
Produces "Bullish Engulfing" identifier label
Parameters:
showLabel (bool) : (series bool) Shows label when input is true. Default is false
labelColor (color) : (series color) Color of the label border and arrow
textColor (color) : (series color) Text color
Returns: (label) A label visible at the chart level intended for the title pattern
bearEngulf(maxRejectWick, mustEngulfWick)
Detects "Bearish Engulfing" candle patterns
Parameters:
maxRejectWick (float) : (float) Maximum rejection wick size.
The maximum wick size as a percentge of body size allowable for a bottom wick on the resolution candle of the pattern. 0.0 disables the filter.
eg. 50 allows a botom wick half the size of the body. Default is 0% (Disables wick detection).
mustEngulfWick (bool) : (bool) Input to only detect setups that close below the low prior effectively engulfing the candle in its entirety. Default is false
Returns: (series bool) True when pattern detected
bebLab(showLabel, labelColor, textColor)
Produces "Bearish Engulfing" identifier label
Parameters:
showLabel (bool) : (series bool) Shows label when input is true. Default is false
labelColor (color) : (series color) Color of the label border and arrow
textColor (color) : (series color) Text color
Returns: (label) A label visible at the chart level intended for the title pattern
hammer(ratio, shadowPercent)
Detects "Hammer" candle patterns
Parameters:
ratio (float) : (float) The relationship of body to candle size (ie. body is 33% of total candle size). Default is 33%.
shadowPercent (float) : (float) The maximum allowable top wick size as a percentage of body size. Default is 5%.
Returns: (series bool) True when pattern detected
hLab(showLabel, labelColor, textColor)
Produces "Hammer" identifier label
Parameters:
showLabel (bool) : (series bool) Shows label when input is true. Default is false
labelColor (color) : (series color) Color of the label border and arrow
textColor (color) : (series color) Text color
Returns: (label) A label visible at the chart level intended for the title pattern
star(ratio, shadowPercent)
Detects "Star" candle patterns
Parameters:
ratio (float) : (float) The relationship of body to candle size (ie. body is 33% of total candle size). Default is 33%.
shadowPercent (float) : (float) The maximum allowable bottom wick size as a percentage of body size. Default is 5%.
Returns: (series bool) True when pattern detected
ssLab(showLabel, labelColor, textColor)
Produces "Star" identifier label
Parameters:
showLabel (bool) : (series bool) Shows label when input is true. Default is false
labelColor (color) : (series color) Color of the label border and arrow
textColor (color) : (series color) Text color
Returns: (label) A label visible at the chart level intended for the title pattern
dragonflyDoji()
Detects "Dragonfly Doji" candle patterns
Returns: (series bool) True when pattern detected
ddLab(showLabel, labelColor, textColor)
Produces "Dragonfly Doji" identifier label
Parameters:
showLabel (bool) : (series bool) Shows label when input is true. Default is false
labelColor (color) : (series color) Color of the label border and arrow
textColor (color)
Returns: (label) A label visible at the chart level intended for the title pattern
gravestoneDoji()
Detects "Gravestone Doji" candle patterns
Returns: (series bool) True when pattern detected
gdLab(showLabel, labelColor, textColor)
Produces "Gravestone Doji" identifier label
Parameters:
showLabel (bool) : (series bool) Shows label when input is true. Default is false
labelColor (color) : (series color) Color of the label border and arrow
textColor (color) : (series color) Text color
Returns: (label) A label visible at the chart level intended for the title pattern
tweezerBottom(closeUpperHalf)
Detects "Tweezer Bottom" candle patterns
Parameters:
closeUpperHalf (bool) : (bool) input to only detect setups that close above the mid-point of the candle prior increasing its bullish tendancy. Default is false
Returns: (series bool) True when pattern detected
tbLab(showLabel, labelColor, textColor)
Produces "Tweezer Bottom" identifier label
Parameters:
showLabel (bool) : (series bool) Shows label when input is true. Default is false
labelColor (color) : (series color) Color of the label border and arrow
textColor (color) : (series color) Text color
Returns: (label) A label visible at the chart level intended for the title pattern
tweezerTop(closeLowerHalf)
Detects "TweezerTop" candle patterns
Parameters:
closeLowerHalf (bool) : (bool) input to only detect setups that close below the mid-point of the candle prior increasing its bearish tendancy. Default is false
Returns: (series bool) True when pattern detected
ttLab(showLabel, labelColor, textColor)
Produces "TweezerTop" identifier label
Parameters:
showLabel (bool) : (series bool) Shows label when input is true. Default is false
labelColor (color) : (series color) Color of the label border and arrow
textColor (color) : (series color) Text color
Returns: (label) A label visible at the chart level intended for the title pattern
spinningTopBull(wickSize)
Detects "Bullish Spinning Top" candle patterns
Parameters:
wickSize (float) : (float) input to adjust detection of the size of the top wick/ bottom wick as a percent of total candle size. Default is 34%, which ensures the wicks are both larger than the body.
Returns: (series bool) True when pattern detected
stwLab(showLabel, labelColor, textColor)
Produces "Bullish Spinning Top" identifier label
Parameters:
showLabel (bool) : (series bool) Shows label when input is true. Default is false
labelColor (color) : (series color) Color of the label border and arrow
textColor (color) : (series color) Text color
Returns: (label) A label visible at the chart level intended for the title pattern
spinningTopBear(wickSize)
Detects "Bearish Spinning Top" candle patterns
Parameters:
wickSize (float) : (float) input to adjust detection of the size of the top wick/ bottom wick as a percent of total candle size. Default is 34%, which ensures the wicks are both larger than the body.
Returns: (series bool) True when pattern detected
stbLab(showLabel, labelColor, textColor)
Produces "Bearish Spinning Top" identifier label
Parameters:
showLabel (bool) : (series bool) Shows label when input is true. Default is false
labelColor (color) : (series color) Color of the label border and arrow
textColor (color) : (series color) Text color
Returns: (label) A label visible at the chart level intended for the title pattern
spinningTop(wickSize)
Detects "Spinning Top" candle patterns
Parameters:
wickSize (float) : (float) input to adjust detection of the size of the top wick/ bottom wick as a percent of total candle size. Default is 34%, which ensures the wicks are both larger than the body.
Returns: (series bool) True when pattern detected
stLab(showLabel, labelColor, textColor)
Produces "Spinning Top" identifier label
Parameters:
showLabel (bool) : (series bool) Shows label when input is true. Default is false
labelColor (color) : (series color) Color of the label border and arrow
textColor (color) : (series color) Text color
Returns: (label) A label visible at the chart level intended for the title pattern
morningStar()
Detects "Bullish Morning Star" candle patterns
Returns: (series bool) True when pattern detected
msLab(showLabel, labelColor, textColor)
Produces "Bullish Morning Star" identifier label
Parameters:
showLabel (bool) : (series bool) Shows label when input is true. Default is false
labelColor (color) : (series color) Color of the label border and arrow
textColor (color) : (series color) Text color
Returns: (label) A label visible at the chart level intended for the title pattern
eveningStar()
Detects "Bearish Evening Star" candle patterns
Returns: (series bool) True when pattern detected
esLab(showLabel, labelColor, textColor)
Produces "Bearish Evening Star" identifier label
Parameters:
showLabel (bool) : (series bool) Shows label when input is true. Default is false
labelColor (color) : (series color) Color of the label border and arrow
textColor (color) : (series color) Text color
Returns: (label) A label visible at the chart level intended for the title pattern
haramiBull()
Detects "Bullish Harami" candle patterns
Returns: (series bool) True when pattern detected
hwLab(showLabel, labelColor, textColor)
Produces "Bullish Harami" identifier label
Parameters:
showLabel (bool) : (series bool) Shows label when input is true. Default is false
labelColor (color) : (series color) Color of the label border and arrow
textColor (color) : (series color) Text color
Returns: (label) A label visible at the chart level intended for the title pattern
haramiBear()
Detects "Bearish Harami" candle patterns
Returns: (series bool) True when pattern detected
hbLab(showLabel, labelColor, textColor)
Produces "Bearish Harami" identifier label
Parameters:
showLabel (bool) : (series bool) Shows label when input is true. Default is false
labelColor (color) : (series color) Color of the label border and arrow
textColor (color) : (series color) Text color
Returns: (label) A label visible at the chart level intended for the title pattern
haramiBullCross()
Detects "Bullish Harami Cross" candle patterns
Returns: (series bool) True when pattern detected
hcwLab(showLabel, labelColor, textColor)
Produces "Bullish Harami Cross" identifier label
Parameters:
showLabel (bool) : (series bool) Shows label when input is true. Default is false
labelColor (color) : (series color) Color of the label border and arrow
textColor (color) : (series color) Text color
Returns: (label) A label visible at the chart level intended for the title pattern
haramiBearCross()
Detects "Bearish Harami Cross" candle patterns
Returns: (series bool) True when pattern detected
hcbLab(showLabel, labelColor, textColor)
Produces "Bearish Harami Cross" identifier label
Parameters:
showLabel (bool) : (series bool) Shows label when input is true. Default is false
labelColor (color) : (series color) Color of the label border and arrow
textColor (color)
Returns: (label) A label visible at the chart level intended for the title pattern
marubullzu()
Detects "Bullish Marubozu" candle patterns
Returns: (series bool) True when pattern detected
mwLab(showLabel, labelColor, textColor)
Produces "Bullish Marubozu" identifier label
Parameters:
showLabel (bool) : (series bool) Shows label when input is true. Default is false
labelColor (color) : (series color) Color of the label border and arrow
textColor (color) : (series color) Text color
Returns: (label) A label visible at the chart level intended for the title pattern
marubearzu()
Detects "Bearish Marubozu" candle patterns
Returns: (series bool) True when pattern detected
mbLab(showLabel, labelColor, textColor)
Produces "Bearish Marubozu" identifier label
Parameters:
showLabel (bool) : (series bool) Shows label when input is true. Default is false
labelColor (color) : (series color) Color of the label border and arrow
textColor (color) : (series color) Text color
Returns: (label) A label visible at the chart level intended for the title pattern
abandonedBull()
Detects "Bullish Abandoned Baby" candle patterns
Returns: (series bool) True when pattern detected
abwLab(showLabel, labelColor, textColor)
Produces "Bullish Abandoned Baby" identifier label
Parameters:
showLabel (bool) : (series bool) Shows label when input is true. Default is false
labelColor (color) : (series color) Color of the label border and arrow
textColor (color) : (series color) Text color
Returns: (label) A label visible at the chart level intended for the title pattern
abandonedBear()
Detects "Bearish Abandoned Baby" candle patterns
Returns: (series bool) True when pattern detected
abbLab(showLabel, labelColor, textColor)
Produces "Bearish Abandoned Baby" identifier label
Parameters:
showLabel (bool) : (series bool) Shows label when input is true. Default is false
labelColor (color) : (series color) Color of the label border and arrow
textColor (color) : (series color) Text color
Returns: (label) A label visible at the chart level intended for the title pattern
piercing()
Detects "Piercing" candle patterns
Returns: (series bool) True when pattern detected
pLab(showLabel, labelColor, textColor)
Produces "Piercing" identifier label
Parameters:
showLabel (bool) : (series bool) Shows label when input is true. Default is false
labelColor (color) : (series color) Color of the label border and arrow
textColor (color) : (series color) Text color
Returns: (label) A label visible at the chart level intended for the title pattern
darkCloudCover()
Detects "Dark Cloud Cover" candle patterns
Returns: (series bool) True when pattern detected
dccLab(showLabel, labelColor, textColor)
Produces "Dark Cloud Cover" identifier label
Parameters:
showLabel (bool) : (series bool) Shows label when input is true. Default is false
labelColor (color) : (series color) Color of the label border and arrow
textColor (color) : (series color) Text color
Returns: (label) A label visible at the chart level intended for the title pattern
tasukiBull()
Detects "Upside Tasuki Gap" candle patterns
Returns: (series bool) True when pattern detected
utgLab(showLabel, labelColor, textColor)
Produces "Upside Tasuki Gap" identifier label
Parameters:
showLabel (bool) : (series bool) Shows label when input is true. Default is false
labelColor (color) : (series color) Color of the label border and arrow
textColor (color) : (series color) Text color
Returns: (label) A label visible at the chart level intended for the title pattern
tasukiBear()
Detects "Downside Tasuki Gap" candle patterns
Returns: (series bool) True when pattern detected
dtgLab(showLabel, labelColor, textColor)
Produces "Downside Tasuki Gap" identifier label
Parameters:
showLabel (bool) : (series bool) Shows label when input is true. Default is false
labelColor (color) : (series color) Color of the label border and arrow
textColor (color) : (series color) Text color
Returns: (label) A label visible at the chart level intended for the title pattern
risingThree()
Detects "Rising Three Methods" candle patterns
Returns: (series bool) True when pattern detected
rtmLab(showLabel, labelColor, textColor)
Produces "Rising Three Methods" identifier label
Parameters:
showLabel (bool) : (series bool) Shows label when input is true. Default is false
labelColor (color) : (series color) Color of the label border and arrow
textColor (color) : (series color) Text color
Returns: (label) A label visible at the chart level intended for the title pattern
fallingThree()
Detects "Falling Three Methods" candle patterns
Returns: (series bool) True when pattern detected
ftmLab(showLabel, labelColor, textColor)
Produces "Falling Three Methods" identifier label
Parameters:
showLabel (bool) : (series bool) Shows label when input is true. Default is false
labelColor (color) : (series color) Color of the label border and arrow
textColor (color) : (series color) Text color
Returns: (label) A label visible at the chart level intended for the title pattern
risingWindow()
Detects "Rising Window" candle patterns
Returns: (series bool) True when pattern detected
rwLab(showLabel, labelColor, textColor)
Produces "Rising Window" identifier label
Parameters:
showLabel (bool) : (series bool) Shows label when input is true. Default is false
labelColor (color) : (series color) Color of the label border and arrow
textColor (color) : (series color) Text color
Returns: (label) A label visible at the chart level intended for the title pattern
fallingWindow()
Detects "Falling Window" candle patterns
Returns: (series bool) True when pattern detected
fwLab(showLabel, labelColor, textColor)
Produces "Falling Window" identifier label
Parameters:
showLabel (bool) : (series bool) Shows label when input is true. Default is false
labelColor (color) : (series color) Color of the label border and arrow
textColor (color) : (series color) Text color
Returns: (label) A label visible at the chart level intended for the title pattern
kickingBull()
Detects "Bullish Kicking" candle patterns
Returns: (series bool) True when pattern detected
kwLab(showLabel, labelColor, textColor)
Produces "Bullish Kicking" identifier label
Parameters:
showLabel (bool) : (series bool) Shows label when input is true. Default is false
labelColor (color) : (series color) Color of the label border and arrow
textColor (color) : (series color) Text color
Returns: (label) A label visible at the chart level intended for the title pattern
kickingBear()
Detects "Bearish Kicking" candle patterns
Returns: (series bool) True when pattern detected
kbLab(showLabel, labelColor, textColor)
Produces "Bearish Kicking" identifier label
Parameters:
showLabel (bool) : (series bool) Shows label when input is true. Default is false
labelColor (color) : (series color) Color of the label border and arrow
textColor (color) : (series color) Text color
Returns: (label) A label visible at the chart level intended for the title pattern
lls(ratio)
Detects "Long Lower Shadow" candle patterns
Parameters:
ratio (float) : (float) A relationship of the lower wick to the overall candle size expressed as a percent. Default is 75%
Returns: (series bool) True when pattern detected
llsLab(showLabel, labelColor, textColor)
Produces "Long Lower Shadow" identifier label
Parameters:
showLabel (bool) : (series bool) Shows label when input is true. Default is false
labelColor (color) : (series color) Color of the label border and arrow
textColor (color) : (series color) Text color
Returns: (label) A label visible at the chart level intended for the title pattern
lus(ratio)
Detects "Long Upper Shadow" candle patterns
Parameters:
ratio (float) : (float) A relationship of the upper wick to the overall candle size expressed as a percent. Default is 75%
Returns: (series bool) True when pattern detected
lusLab(showLabel, labelColor, textColor)
Produces "Long Upper Shadow" identifier label
Parameters:
showLabel (bool) : (series bool) Shows label when input is true. Default is false
labelColor (color) : (series color) Color of the label border and arrow
textColor (color) : (series color) Text color
Returns: (label) A label visible at the chart level intended for the title pattern
bullNeck()
Detects "Bullish On Neck" candle patterns
Returns: (series bool) True when pattern detected
nwLab(showLabel, labelColor, textColor)
Produces "Bullish On Neck" identifier label
Parameters:
showLabel (bool) : (series bool) Shows label when input is true. Default is false
labelColor (color) : (series color) Color of the label border and arrow
textColor (color) : (series color) Text color
Returns: (label) A label visible at the chart level intended for the title pattern
bearNeck()
Detects "Bearish On Neck" candle patterns
Returns: (series bool) True when pattern detected
nbLab(showLabel, labelColor, textColor)
Produces "Bearish On Neck" identifier label
Parameters:
showLabel (bool) : (series bool) Shows label when input is true. Default is false
labelColor (color) : (series color) Color of the label border and arrow
textColor (color) : (series color) Text color
Returns: (label) A label visible at the chart level intended for the title pattern
soldiers(wickSize)
Detects "Three White Soldiers" candle patterns
Parameters:
wickSize (float) : (float) Maximum allowable top wick size throughout pattern expressed as a percent of total candle height. Default is 5%
Returns: (series bool) True when pattern detected
wsLab(showLabel, labelColor, textColor)
Produces "Three White Soldiers" identifier label
Parameters:
showLabel (bool) : (series bool) Shows label when input is true. Default is false
labelColor (color) : (series color) Color of the label border and arrow
textColor (color) : (series color) Text color
Returns: (label) A label visible at the chart level intended for the title pattern
crows(wickSize)
Detects "Three Black Crows" candle patterns
Parameters:
wickSize (float) : (float) Maximum allowable bottom wick size throughout pattern expressed as a percent of total candle height. Default is 5%
Returns: (series bool) True when pattern detected
bcLab(showLabel, labelColor, textColor)
Produces "Three Black Crows" identifier label
Parameters:
showLabel (bool) : (series bool) Shows label when input is true. Default is false
labelColor (color) : (series color) Color of the label border and arrow
textColor (color) : (series color) Text color
Returns: (label) A label visible at the chart level intended for the title pattern
triStarBull()
Detects "Bullish Tri-Star" candle patterns
Returns: (series bool) True when pattern detected
tswLab(showLabel, labelColor, textColor)
Produces "Bullish Tri-Star" identifier label
Parameters:
showLabel (bool) : (series bool) Shows label when input is true. Default is false
labelColor (color) : (series color) Color of the label border and arrow
textColor (color) : (series color) Text color
Returns: (label) A label visible at the chart level intended for the title pattern
triStarBear()
Detects "Bearish Tri-Star" candle patterns
Returns: (series bool) True when pattern detected
tsbLab(showLabel, labelColor, textColor)
Produces "Bearish Tri-Star" identifier label
Parameters:
showLabel (bool) : (series bool) Shows label when input is true. Default is false
labelColor (color) : (series color) Color of the label border and arrow
textColor (color) : (series color) Text color
Returns: (label) A label visible at the chart level intended for the title pattern
insideBar()
Detects "Inside Bar" candle patterns
Returns: (series bool) True when pattern detected
insLab(showLabel, labelColor, textColor)
Produces "Inside Bar" identifier label
Parameters:
showLabel (bool) : (series bool) Shows label when input is true. Default is false
labelColor (color) : (series color) Color of the label border and arrow
textColor (color) : (series color) Text color
Returns: (label) A label visible at the chart level intended for the title pattern
doubleInside()
Detects "Double Inside Bar" candle patterns
Returns: (series bool) True when pattern detected
dinLab(showLabel, labelColor, textColor)
Produces "Double Inside Bar" identifier label
Parameters:
showLabel (bool) : (series bool) Shows label when input is true. Default is false
labelColor (color) : (series color) Color of the label border and arrow
textColor (color) : (series color) Text color
Returns: (label) A label visible at the chart level intended for the title pattern
wrap(cond, barsBack, borderColor, bgColor)
Produces a box wrapping the highs and lows over the look back.
Parameters:
cond (bool) : (series bool) Condition under which to draw the box.
barsBack (int) : (series int) the number of bars back to begin drawing the box.
borderColor (color) : (series color) Color of the four borders. Optional. The default is `color.gray` with a 45% transparency.
bgColor (color)
Returns: (box) A box whom's top and bottom are above and below the highest and lowest points over the lookback
topWick()
Returns the top wick size of the current candle
Returns: (series float) A value equivelent to the distance from the top of the candle body to its high
bottomWick()
Returns the bottom wick size of the current candle
Returns: (series float) A value equivelent to the distance from the bottom of the candle body to its low
body()
Returns the body size of the current candle
Returns: (series float) A value equivelent to the distance between the top and the bottom of the candle body
highestBody()
Returns the highest body of the current candle
Returns: (series float) A value equivelent to the highest body, whether it is the open or the close
lowestBody()
Returns the lowest body of the current candle
Returns: (series float) A value equivelent to the highest body, whether it is the open or the close
barRange()
Returns the height of the current candle
Returns: (series float) A value equivelent to the distance between the high and the low of the candle
bodyPct()
Returns the body size as a percent
Returns: (series float) A value equivelent to the percentage of body size to the overall candle size
midBody()
Returns the price of the mid-point of the candle body
Returns: (series float) A value equivelent to the center point of the distance bewteen the body low and the body high
bodyupGap()
Returns true if there is a gap up between the real body of the current candle in relation to the candle prior
Returns: (series bool) True if there is a gap up and no overlap in the real bodies of the current candle and the preceding candle
bodydwnGap()
Returns true if there is a gap down between the real body of the current candle in relation to the candle prior
Returns: (series bool) True if there is a gap down and no overlap in the real bodies of the current candle and the preceding candle
gapUp()
Returns true if there is a gap down between the real body of the current candle in relation to the candle prior
Returns: (series bool) True if there is a gap down and no overlap in the real bodies of the current candle and the preceding candle
gapDwn()
Returns true if there is a gap down between the real body of the current candle in relation to the candle prior
Returns: (series bool) True if there is a gap down and no overlap in the real bodies of the current candle and the preceding candle
dojiBody()
Returns true if the candle body is a doji
Returns: (series bool) True if the candle body is a doji. Defined by a body that is 5% of total candle size
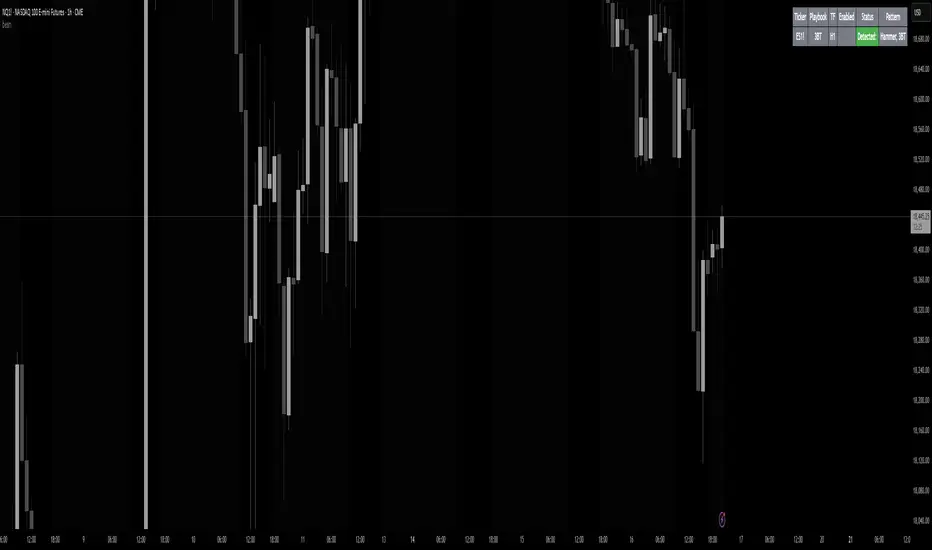
Key Indicators Dashboard (KID)Key Indicators Dashboard (KID) — Comprehensive Market & Trend Metrics
📌 Overview
The Key Indicators Dashboard (KID) is an advanced multi-metric market analysis tool designed to consolidate essential technical, volatility, and relative performance data into a single on-chart table. Instead of switching between multiple indicators, KID centralizes these key measures, making it easier to assess a stock’s technical health, volatility state, trend status, and relative strength at a glance.
🛠 Key Features
⦿ Average Daily Range (ADR %): Measures average daily price movement over a specified period. It is calculated by averaging the daily price range (high - low) over a set number of days (default 20 days).
⦿ Average True Range (ATR): Measures volatility by calculating the average of a true range over a specific period (default 14). It helps traders gauge the typical extent of price movement, regardless of the direction.
⦿ ATR%: Expresses the Average True Range as a percentage of the price, which allows traders to compare the volatility of stocks with different prices.
⦿ Relative Strength (RS): Compares a stock’s performance to a chosen benchmark index (default NIFTYMIDSML400) over a specific period (default 50 days).
⦿ RS Score (IBD-style): A normalized 1–100 rating inspired by Investor’s Business Daily methodology.
How it works: The RS Score is based on a weighted average of price changes over 3 months (40%), 6 months (20%), 9 months (20%), and 12 months (20%).
The raw value is converted into a percentage return, then normalized over the past 252 trading days so the lowest value maps to 1 and the highest to 100.
This produces a percentile-style score that highlights the strongest stocks in relative terms.
⦿ Relative Volume (RVol): Compares a stock's current volume to its average volume over a specific period (default 50). It is calculated by dividing the current volume by the average historical volume.
⦿ Average ₹ Volume (Turnover): Represents the total monetary value of shares traded for a stock. It's calculated by multiplying a day's closing price by its volume, with the final value converted to crores for clarity. This metric is a key indicator of a stock's liquidity and overall market interest.
⦿ Moving Average Extension: Measures how far a stock's current price has moved from from a selected moving average (EMA or SMA). This deviation is normalized by the stock's volatility (ATR%), with a default threshold of 6 ATR used to indicate that the stock is significantly extended and is marked with a selected shape (default Red Flag).
⦿ 52-Weeks High & Low: Measures a stock's current price in relation to its highest and lowest prices over the past year. It calculates the percentage a stock is below its 52-week high and above its 52-week low.
⦿ Market Capitalization: Market Cap represents the total value of all outstanding.
⦿ Free Float: It is the value of shares readily available for public trading, with the Free Float Percentage showing the proportion of shares available to the public.
⦿ Trend: Uses Supertrend indicator to identify the current trend of a stock's price. A factor (default 3) and an ATR period (default 10) is used to signal whether the trend is up or down.
⦿ Minervini Trend Template (MTT): It is a set of technical criteria designed to identify stocks in strong uptrends.
Price > 50-DMA > 150-DMA > 200-DMA
200-DMA is trending up for at least 1 month
Price is at least 30% above its 52-week low.
Price is within at least 25 percent of its 52-week high
Table highlights when a stock meets all above criteria.
⦿ Sector & Industry: Display stock's sector and industry, provides categorical classification to assist sector-based analysis. The sector is a broad economic classification, while the industry is a more specific group within that sector.
⦿ Moving Averages (MAs): Plot up to four customizable Moving Averages on a chart. You can independently set the type (Simple or Exponential), the source price, and the length for each MA to help visualize a stock's underlying trend.
MA1: Default 10-EMA
MA2: Default 20-EMA
MA3: Default 50-EMA
MA4: Default 200-EMA
⦿ Moving Average (MA) Crossover: It is a trend signal that occurs when a shorter-term moving average crosses a longer-term one. This script identifies these crossover events and plots a marker on the chart to visually signal a potential change in trend direction.
User-configurable MAs (short and long).
A bullish crossover occurs when the short MA crosses above the long MA.
A bearish crossover occurs when the short MA crosses below the long MA.
⦿ Inside Bar (IB): An Inside Bar is a candlestick whose entire price range is contained within the range of the previous bar. This script identifies this pattern, which often signals consolidation, and visually marks bullish and bearish inside bars on the chart with distinct colors and labels.
⦿ Tightness: Identifies periods of low volatility and price consolidation. It compares the price range over a short lookback period (default 3) to the average daily range (ADR). When the lookback range is smaller than the ADR, the indicator plots a marker on the chart to signal consolidation.
⦿ PowerBar (Purple Dot): Identifies candles with a strong price move on high volume. By default, it plots a purple dot when a stock moves up or down by at least 5% and has a minimum volume of 500,000. More dots indicate higher volatility and liquidity.
⦿ Squeezing Range (SQ): Identifies periods of low volatility, which can often precede a significant price move. It checks if the Bollinger Bands have narrowed to a range that is smaller than the Average True Range (ATR) for a set number of consecutive bars (default 3).
(UpperBB - LowerBB) < (ATR × 2)
⦿ Mark 52-Weeks High and Low: Marks and labels a stock's 52-Week High and Low prices directly on the chart. It draws two horizontal lines extending from the candles where the highest and lowest prices occurred over the past year, providing a clear visual reference for long-term price extremes.
⏳PineScreener Filters
The indicator’s alert conditions act as filters for PineScreener.
Price Filter: Minimum and maximum price cutoffs (default ₹25 - ₹10000).
Daily Price Change Filter: Minimum and maximum daily percent change (default -5% and 5%).
🔔 Built-in Alerts
Supports alert creation for:
ADR%, ATR/ATR %, RS, RS Rating, Turnover
Moving Average Crossover (Bullish/Bearish)
Minervini Trend Template
52-Week High/Low
Inside Bars (Bullish/Bearish)
Tightness
Squeezing Range (SQ)
⚙️ Customizable Visualization
Switchable between vertical or horizontal layout.
Works in dark/light mode
User-configurable to toggle any indicator ON or OFF.
User-configurable Moving (EMA/SMA), Period/Lengths and thresholds.
⦿ (Optional) : For horizontal table orientation increase Top Margin to 16% in Chart (Canvas) settings to avoid chart overlapping with table.
⚡ Add this script to your chart and start making smarter trade decisions today! 🚀

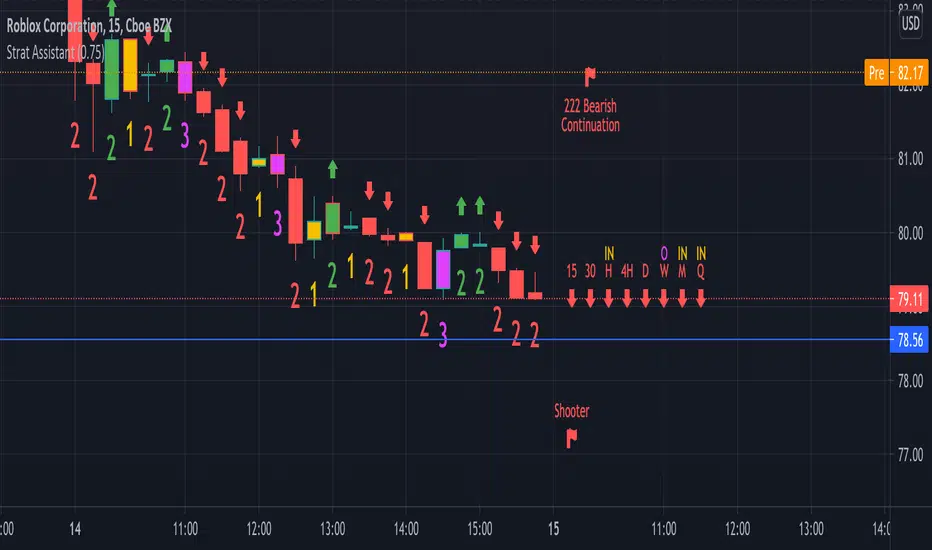
Strat AssistantStrat Assistant
This script will help you follow the strat. While other collections of scripts exist to do similar functionality, the idea of this (work in progress) is to be a one stop shop for all things strat that will evolve over time. Fairly new to the strat and pine script. The script is for informational purposes only. Please do you due diligence.
Features:
=Candle numbering: will number candles underneath based on the prior candle. 1 for an inside bar 2 for a directional bar (up or down) and 3 for an outside bar.
=Candle coloring: will highlight candles. Yellow for an inside candle, magenta for an outside candle, red for a 2 down candle, green for a 2 up candle. It will not modify the outside border of the candle so you can still see green if the open was lower than the close or red if the close was below open.
=Candle shape: will place an arrow up if the 2 candle is a directional UP and arrows down if the 2 candle is a directional DOWN. It will display red if it's bearish and green if it's bullish.
=Strat combos: will provide a text description of all currently applicable strat combinations if they are active at the top right of the chart. It will display red if it's bearish and green if it's bullish.
=Actionable signals: will provide text description of actionable signals if they are active on the bottom right of the chart. Inside bar if the bar is inside the prior bar, the color of this signal will be blue (shows better on white background). Hammer will be 75% of the candle is at the bottom and the open and close are above the 75% of the wick. Hammers will display green for bullish. Shooters are just the opposite of hammers, 75% of the wick is at the top and the open and close are below 75% of the wick. Shooters will display at red for bearish.
=Time Frame Continuity: will provide time frame continuity across 15m, 30m, Hour, Day, Week, Quarter, Year with green arrows up if the close is above the open for the given time frame, or red arrows down if the close is below the open for the given time frame. This will also look to determine if the time frame is applicable based on what time frame the user selects as well as ensures history exists for the given time frame.
Backlog / Work in progress:
=Opacity for time frame continuity
=Line indicators (or maybe just a label) for highs and lows of previous periods (hour, day, week, quarter)
=Alert conditions
=User input for various indicators
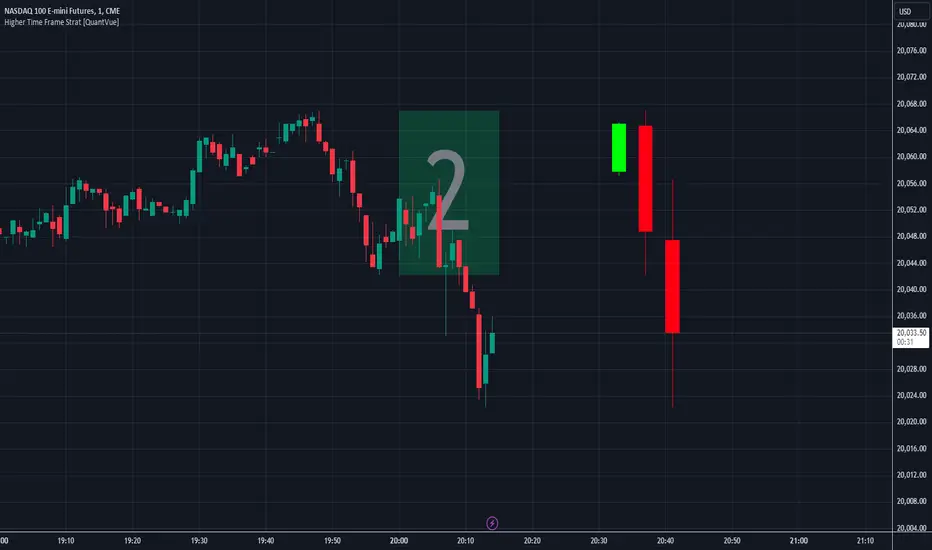
Higher Time Frame Strat [QuantVue]The Higher Time Frame Strat Indicator is a tool that helps traders visualize and analyze price action from a higher timeframe (HTF) on their current chart. It applies the Strat method, a trading strategy focused on identifying key price action setups by observing how current price bars relate to previous ones. This helps in understanding the market's structure and determining potential trading opportunities based on higher timeframe data.
Key Concepts:
Strat Basics:
Type 1 Bar (Inside Bar): The current bar's high is lower than the previous bar's high, and its low is higher than the previous bar's low. This signifies a consolidation, or indecision, as the price is contained within the previous bar's range.
Type 2 Bar (Directional Bar): The current bar either breaks above the previous bar's high (bullish) or stays above the previous bar's low (bearish), indicating a continuation in the price direction.
Type 3 Bar (Outside Bar): The current bar breaks both above the previous bar's high and below the previous bar's low, showing volatility and a potential reversal.
Higher Timeframe Visualization:
The indicator uses a user-defined higher timeframe (default: 1 hour) and plots the last three higher timeframe candles on the current chart.
Strat Classification:
When a new higher timeframe candle forms, the indicator draws a semi-transparent box around the candle's range (high to low), along with the Strat type label. This provides a visual cue to the trader about the structure of the newly formed candle and how it fits into the overall market movement.
The script classifies each higher timeframe candle as one of the Strat types (1, 2, or 3). Based on the relationship between the current candle and the previous candle's high/low, it assigns a label ("1", "2", or "3"), helping traders quickly identify the price action setup on the higher timeframe.
How to Use the Indicator:
Trend Continuation: Look for Type 2 bars, which indicate a continuation in the current trend. For example, a Type 2 up suggests the price is breaking above the previous high, potentially signaling further upward movement.
Reversals: Type 3 bars show increased volatility, where the price breaks both above and below the previous bar's range. This could indicate a reversal, so be prepared for a potential change in direction.
Consolidation: Inside bars (Type 1) signify a tightening range and can signal the beginning of a breakout once the price moves outside of the previous bar's high or low.
By combining these price action concepts with the visualization of higher timeframe data, traders can potentially get earlier entry and exits as a higher timeframe set up forms.
GL Gann Swing IndicatorIntroduction
The GL Gann Swing Indicator is a versatile tool designed to help traders identify market trends, support and resistance areas, and potential reversals. This indicator applies the principles of Gann Swing Charts, a technique developed by W.D. Gann, which focuses on market swings to determine the overall direction and turning points of price action. Gann Swing Charts are a time-tested method of technical analysis that simplifies price action by focusing on significant highs and lows, thereby eliminating market noise and providing a clearer view of the trend.
By analyzing price action and determining swing directions and turning points, the indicator filters out market noise using four distinct bar types:
Up Bar: Higher High, Higher Low
Down Bar: Lower High, Lower Low
Inside Bar: Lower High, Higher Low
Outside Bar: Higher High, Lower Low
This approach helps traders to:
Identify the primary trend direction.
Determine key support and resistance levels.
Recognize potential reversal points.
Filter out minor price fluctuations that do not affect the overall trend.
Features
Bar Types: Display bar types by checking the Show Bar Type box in the indicator's settings. Up bars appear as green upward-pointing triangles, down bars as red downward-pointing triangles, inside bars as grey circles, and outside bars as blue diamonds. These visual aids help traders quickly identify the type of bar and its significance.
Break Lines: These lines highlight when the price rises above a previous swing high or falls below a prior swing low. Green lines indicate breaks of swing highs, while red lines indicate breaks of swing lows. Break lines are enabled by default but can be turned off in the indicator's settings. Break lines provide visual confirmation of trend continuation or reversal.
Bar Count: Bar counts help determine if a swing is overextended and if a reversal is likely. This feature is off by default but can be enabled in the indicator's settings. Users can set a minimum bar count to focus on significant swings. Analyzing the number of bars in a swing can help traders gauge the strength and potential exhaustion of a trend.
Swing MA (Moving Averages): This feature plots the average of a user-defined number of previous swing highs and lows. Options are available to add two moving averages, allowing for both fast and slow averages. Swing MAs can be enabled in the indicator's settings. These moving averages smooth out the price data, making it easier to identify the underlying trend direction.
Why This Indicator is Useful
The GL Gann Swing Indicator is particularly useful for several reasons:
Trend Identification: By focusing on significant price swings, the indicator helps traders identify the primary trend direction, making it easier to align trades with the overall market movement.
Noise Reduction: The indicator filters out minor price fluctuations, allowing traders to focus on meaningful market movements and avoid being misled by short-term volatility.
Support and Resistance Levels: By highlighting key swing highs and lows, the indicator helps traders identify crucial support and resistance levels, which are essential for making informed trading decisions.
Potential Reversals: The indicator's ability to identify overextended swings and potential reversal points can help traders anticipate market turning points and adjust their strategies accordingly.
Customizability: With options to display bar types, break lines, bar counts, and swing moving averages, traders can customize the indicator to suit their specific trading style and preferences.
By incorporating Gann Swing principles, the GL Gann Swing Indicator offers traders a powerful tool to enhance their technical analysis, improve their trading decisions, and ultimately achieve better trading outcomes.

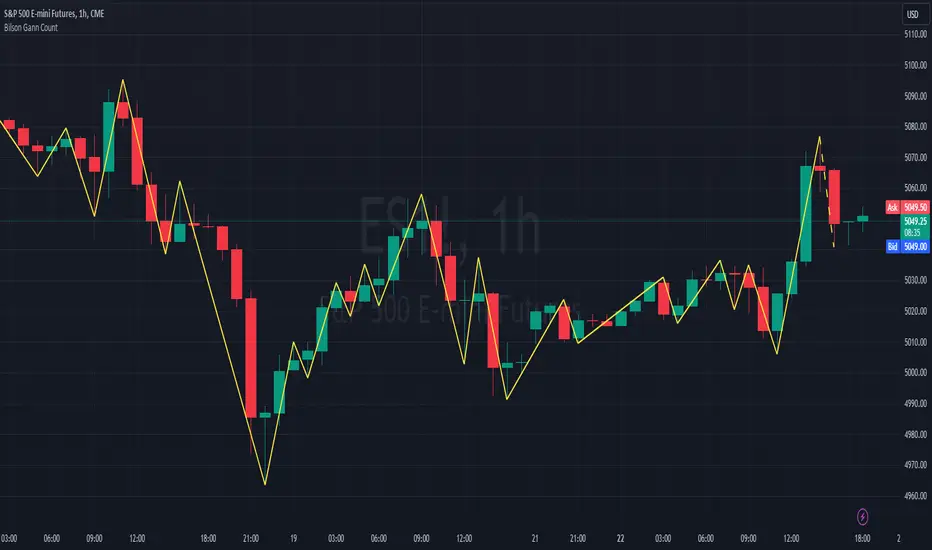
Bilson Gann CountGann counting is a method for identifying swing points,trends, and overall market structure. It simplifies price action by drawing short trend lines that summarize moves.
There's essentially 4 types of bar/candle.
Up bar - Higher high and higher low than previous bar
Down bar - Lower high and lower low than previous bar
Inside bar - Lower high and higher low than previous bar
Outside bar - Higher high and lower low than previous bar
We use these determinations to decide how the trendline moves through the candles.
Up bars we join to the high, down bars we join to the low, inside bars are ignored.
There are other indicators that already exist which do this, the difference here is how we handle outside bars.
Other gann counting methods skip outside bars, this method determines how to handle the outside bar after the outside bar is broken.
examples
UP -> OUTSIDE -> UP = Outside bar treated as swing low
UP -> OUTSIDE -> DOWN = Outside bar treated as swing high
DOWN -> OUTSIDE -> UP = Outside bar treated as swing low
DOWN -> OUTSIDE -> DOWN = Outside bar treated as swing high
LNL Scalper ArrowsLNL Scalper Arrows
The indicator consist of various different types of candlestick patterns that are truly time tested by multiple veteran traders. These arrows are a combination of short-term scalping strategies taught by Linda Raschke & a trader that goes by name Quant Trade Edge. These strategies/patterns occur regularly within the markets. They offer high probability quick moves during the trending days. These four patterns are based on pure price action, no oscillators, no trend, no momentum indicators involved. Trend (ema) is there just as a simple trend gauge.
LNL Scalper Arrows were designed specifically for intra-day trading. Mostly useful for the futures but also stocks as well. These arrows can work anywhere between the fast-moving 512 or 1600 tick charts to a 1min, 2min and up to 5min or 10min charts.
Trend Gauge (Exponential Moving Average)
Nothing fancy just a classic EMA that can guide the direction of the short-term trend. I have added a custom coloring of the EMA that is based on a simple RSI filter. That should help to visualize the non-directional moments within the trend. Although the length is adjustable, for scalping it is better to focus on smaller periods such as 9, 13 or 20 or 34 but anything above 50 loses its purpose as a short-term trend gauge. Again, this is a scalping tool not a trend tool, you are not going to get rid of the fakeouts by increasing the period of the trend.
Tail Arrows (Eat the Tail Pattern)
Tail is a candlestick that is either a price rejection spike, or a flag continuation pattern on a lower time frame. A failed action. It is basically a candle with much bigger wick (shadow) of the candle than the actual body. Such candles are usually telling us about strong participation from the other side of the market. Eat the tail pattern occurs whenever the low of the Tail candle is immediately broken on a following candle "the tail is eaten alive". Such a breaks occurs in a most aggressive types of markets with a strong momentum. DO NOT try to trade this in a low volume or a ranging market. Tail Arrows are the most aggressive arrows & should be only used on the highest volume or a parabolic momentum markets.
Scalp Arrows (Scallop Pattern)
Known as Scallops or minor lows or highs, these patterns are the most common within the all scalper arrows. They occur regularly on 1min & 5min charts - basically everyday. Scallops provide the best possible risk to reward entry within the trend without the need of any indicators or oscillators. The Scallop Up 3 bar pattern consist of a high that is lower that the previous high but also low that is lower than the previous low. Scallop Up or a minor low triggers when the last high is broken, creating a three bar mountain or a peak within the 5 bar span.
Hoagie Arrows (Hoagie Pattern)
Hoagies occur way less often than any other scalping patterns. Hoagies represent two (or more) inside candles within the shadow of a first candle. Such a formation is creating a small compression or a range that sooner or later breaks out. The hoagie is triggered whenever the high or low of the shadow (first) candle is broken. The great thing about the hoagies is that they can work either way despite the trend direction. Although this indicator is coded for the 2 bar hoagies, there are no limitations on how much inside bars can hoagie include.
Umbrella Arrows (Umbrella Pattern)
Another really awesome 3 bar pattern that is really fun to trade. Umbrella occurs when the candle before the previous candle is a pin bar or a tail bar and the body of the previous candle is within the shadow or a wick of the candle before. The umbrella is triggered once the high or low of the previous bar is broken. Umbrellas are more frequent than Hoagies but occur much less than the Scallops.
Outside Bar Wedges (Outside Bar Pattern)
Pretty much self-explanatory candlestick pattern. Outside Bar is basically any bar that peaks outside of the both ends of the previous candle. So the range of the candle is higher & it looked beyond the high and beyond the low of the previous candle. These candles are signalizing the potenial momentum change. Ouside Bars usually occur at the tops or bottoms of the moves. I decided to add them because they can serve as a great addition to these scalping patterns.
Signal vs. SignalBreak Mode
The trigger can be viewed in two different ways:
1. Signal: Plots the trigger before the trigger bar, basically right when the pattern is formed but NOT YET triggered. The signal is triggered once the next candle break the high or low of the current candle.
2. SignalBrake: Plots the trigger after the break of the high or low of the actual pattern. It is basically a candle after the signal candle. (Signal is better for trading because it gives you time to prepare for the actual break of the high or low = the actual signal. SignalBrake is great for looking back in history only for the patterns that actually traded).
Pin Bar BTW Ratio
Pin Bar (Body-To-Wick) Ratio represents the size of the body of a pin bar candle for Eat the Tail and Umbrella patterns. Pin Bar BTW Ratio measures the ratio between the wick & the body of the candle. Ref. interval is 2.0 - 5.0 (ideal pin bar is 2.0 - 3.0 = the wick or a shadow is 2x - 3x bigger than the body of the candle)
ATR Stop & Target Labels
I also created three simple labels (tables) that can show you the ideal target & stop as well as the current ATR. Since LNL Scalper Arrows consist of high probability scalping patterns, a good rule of thumb to follow is to use a half of the current ATR as a target and a current ATR as a stop (or two times the target). So if the current 7 period ATR is 30 the target would be 15 pts. and a stop around 30 pts. With such a risk management you should aim for a win rate 70% or higher. Obviously you can adjust the risk management in the settings to your personal preference.
Low Range vs. High Range Markets
There are two major downsides with the Scalper Arrows:
1. You need volume and a volatility. These patterns really do struggle in ranging "boring" sideways action. It is absolutely crucial to recognize the current market environment and really stay cautions and (or completely out) in case the chop continues. Adding something like DMI can help you recognize the potential flat markets.
2. Not only do you need volume & momentum, you also need a decent range. This indicator works better on a rangy market such as NQ futures or YM. But are much tougher to trade on lower range markets such as some stocks or ZB futures or basically any other lower range market.
Hope it helps.

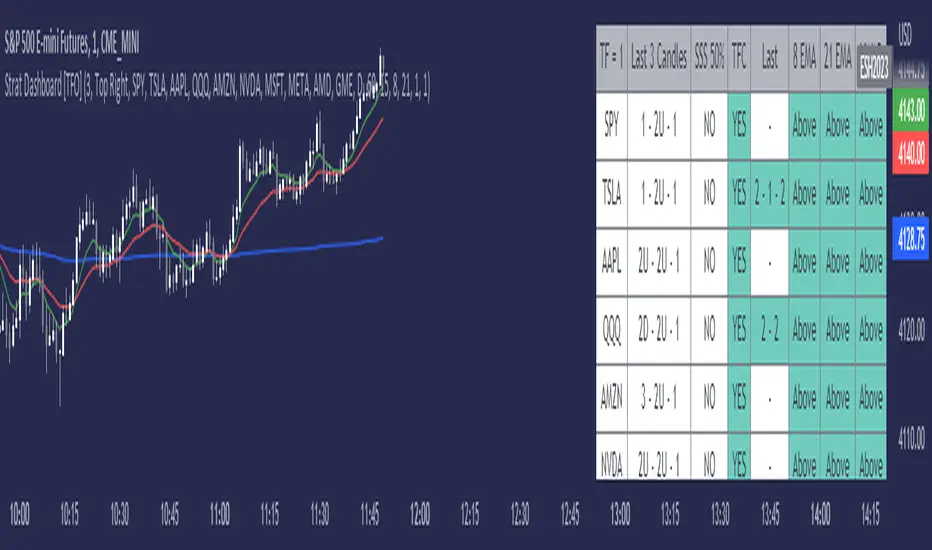
Strat Dashboard [TFO]The Strat Dashboard tracks up to 10 signals while highlighting common strat reversal patterns, the SSS 50% rule, timeframe continuity, and some additional criteria with VWAP and moving averages.
With the strat, all price action bars/candles are simplified into 3 total possibilities: 1 (inside bar), 2 (a bar that takes the previous bar's high OR low), and 3 (outside bar). The first table column for Last X Candles shows the most recent candles according to this notation, for example, 1 - 2D - 2U. This would mean we had an inside bar, followed by a bar that took the previous bar's low, followed then by a bar that took the previous bar's high. Note that the colors in this column are set according to whether the current bar's close exceeds the previous bar's high/low. By default, these colors are green if above the previous bar's highs, or red if below the previous bar's lows. If the current close is in between the previous candle's high and low (even after already taking the prior high or low), no color will be applied.
The SSS 50% column shows a yes or no value for whether the current bar aligns with the SSS 50% rule, where a bar has taken either the previous high or low, and has since reversed to at least the midway point of the previous bar's height - essentially anticipating a 2 that may become a 3 (outside bar).
Timeframe continuity (TFC) shows a yes or no value for when the current candle on multiple timeframes are all green or red (above the open price or below the open price, respectively). For example, if you were looking at the current 15m, 1h, and 1D bars, and they were all above the open price, you could say there's TFC between all three timeframes. As of the initial release, you can select up to 3 different timeframes. The table values will only be true when all selected timeframes are in alignment. When setting alerts, first deselect the timeframes if you don't want TFC logic to impact alerts.
The "Last" column shows the last strat reversal pattern that was confirmed (after the last bar closes). Waiting for a candle close is the safer option since a 2 can turn into a 3; however for higher timeframes, it may be beneficial to make an update to this indicator in which you can have live alerts as well (not waiting for a candle close). You can select which strat reversals you want to be shown from the settings. Various strat reversals may be selected for alerts of type "Any"; for example, if setting up an alert for "Any" strat reversal on Symbol 1, then this alert will go off when any of the *selected* strat reversals occur for that specific symbol. Deselect any strat reversals that you don't want to be included in these alerts.
Lastly, the EMA and VWAP columns simply show whether price is above or below said value. This tracks the current candle close, and may repaint/change several times if the current bar is oscillating above and below these values.
beanBean's Multi-Instrument Pattern Scanner.
This indicator scans H1 timeframe for specific technical patterns. Here's how each pattern is detected:
PATTERN DETECTION CRITERIA:
1. Hammer
- Body Size: ≤ 30% of total candle length
- Lower Wick: > 50% of total candle length
- Upper Wick: < 20% of total candle length
- Formula:
* bodySize = |close - open|
* upperWick = high - max(open, close)
* lowerWick = min(open, close) - low
* totalLength = high - low
2. Shooting Star
- Body Size: ≤ 30% of total candle length
- Upper Wick: > 50% of total candle length
- Lower Wick: < 20% of total candle length
- Uses same measurements as Hammer but inverted
3. Outside/Inside (OI)
Checks three consecutive bars:
- Outside Bar: Bar2 high ≥ Bar3 high AND Bar2 low ≤ Bar3 low
- Inside Bar: Bar1 high ≤ Bar2 high AND Bar1 low ≥ Bar2 low
Pattern confirms when both conditions are met
4. Bullish/Bearish Umbrella
Checks two consecutive bars:
Bullish:
- Current bar's high ≤ previous bar's high
- Current body high ≤ previous bar's high
- Current body low ≥ previous body high
Bearish:
- Current bar's low ≥ previous bar's low
- Current body low ≥ previous bar's low
- Current body high ≤ previous body low
5. Three Bar Triangle (3BT)
Checks three consecutive bars:
- Current bar's high ≤ max(previous two highs)
- Current bar's low ≥ min(previous two lows)
- Indicates price compression
DISPLAY AND ALERTS:
- Patterns are displayed in real-time in the table
- Multiple patterns can be detected simultaneously
- Pattern detection resets each new H1 candle
CONFIGURATION:
- Each row can be independently configured
- Patterns are checked on H1 timeframe close
- Alert frequency: Once per H1 bar close
Note: All measurements use standard OHLC values from only completed H1 candles.
FVG HTF# FVG HTF — Higher‑Timeframe Fair Value Gaps
## Summary
- Plots higher‑timeframe Fair Value Gap (FVG) zones directly on your current chart.
- Tracks fill progress using four methods: Any Touch, Midpoint Reached, Wick Sweep, Body Beyond.
- Shows optional labels with timeframe source and live fill percentage; label text color is configurable.
- Designed for clean overlays and efficient rendering with limits on graphics and bars processed.
## What It Does
- Detects bullish and bearish FVGs from a chosen timeframe (or the chart timeframe) and renders:
- Zone Top/Bottom lines and a dotted midpoint line
- Semi‑transparent area fill between the edges
- Optional label at the midpoint with a tooltip showing zone prices
- Continuously updates zones forward and removes them when the selected fill condition is met.
## Inputs
- `Enable FVG` (`fvgSH2`): Toggle detection/plotting on/off.
- `Timeframe` (`fvgTF2`): Choose `Chart` or HTFs (`5 Minutes`, `15 Minutes`, `1 Hour`, `4 Hours`, `1 Day`, `1 Week`, `1 Month`).
- `Fill Method` (`fvgFill2`):
- Any Touch — wick or body touches any part of the zone
- Midpoint Reached — price reaches at least the 50% of the zone
- Wick Sweep — wick fully travels past the far edge and back inside (conceptually stricter than touch)
- Body Beyond — candle body closes beyond the opposite edge (strong confirmation)
- `Zones` colors (`fvgCb2`, `fvgCs2`): Bullish/Bearish zone colors.
- `Labels` (`fvgLB2`): Show/Hide on‑chart labels.
- `Label Color` (`fvgLBc2`): Color picker for label text (default: white).
- `Max Bars Back` (`maxBars2`): Limits processing to recent bars for performance.
## Timeframe Rules
- The helper `htfTF` prevents selecting a timeframe lower than the chart. If an invalid lower TF is chosen, it falls back to `timeframe.period`.
- Supports minute, daily, weekly, and monthly aggregations that are safe for intraday/daily/weekly charts.
## Detection Logic
- Uses rolling higher‑timeframe bars constructed on the fly and checks 3‑bar displacement patterns:
- Bullish FVG: current HTF low above the high two bars ago AND previous HTF close above that high, with no direct gap condition.
- Bearish FVG: current HTF high below the low two bars ago AND previous HTF close below that low, with no direct gap condition.
- On detection, the script creates an FVG object with:
- Top/Bottom lines (`lnTop`, `lnBtm`) and midpoint line (`lnAvg`)
- Midpoint label (`lbTxt`) showing source timeframe and updating fill percentage
- Semi‑transparent fill (`linefill`) for visual clarity
## Fill Tracking
- Fill threshold depends on selected method:
- Any Touch: opposite edge
- Midpoint Reached: zone’s midpoint
- Wick Sweep: stricter condition conceptually (implemented as an opposite‑edge threshold)
- Body Beyond: requires close beyond the opposite edge
- Each bar updates label x‑position and line endpoints forward; the label text shows the best fill ratio achieved.
- When the threshold is reached, the FVG (label, lines, fill) is removed from the chart.
## Best Practices
- Start with `Any Touch` to visualize broad repairs; switch to `Body Beyond` for conservative confirmations.
- Use `1 Hour` or `4 Hours` overlays on 5m–15m charts for context; `1 Day` on 1H charts; `1 Week` on daily charts.
- Keep labels on when monitoring fills intraday; hide labels for clean higher‑level context.
- Adjust `Max Bars Back` if performance is impacted by many zones.
## Repainting Notes
- HTF zones are computed on `timeframe.change(tf)` and therefore confirm on HTF bar closes.
- Label endpoints extend each bar; detection itself avoids lookahead bias. For strict confirmation, align entries with HTF closes.
## Limitations
- “Wick Sweep” is treated as a stricter touch to the far edge; it does not enforce a separate “return inside” bar state.
- Label text color applies uniformly to bull/bear labels. If you need separate colors per side, contact the author.
## Credits & Version
- Pine Script v6; © rithsilanew2020
## Quick Start
1. Enable FVG and choose your HTF (e.g., `1 Hour`).
2. Pick a Fill Method (start with `Any Touch`).
3. Select zone colors and label text color.
4. Set `Max Bars Back` as needed for performance.
5. Use labels/tooltip values (Top/Mid/Bottom) to plan entries and manage risk.

MY BOX by GustavoThis box contains two strategies, several moving averages and Bollinger Bands.
PFR or "Reversal closing price" is a simple and effective strategy, widespread by the Brazilian trader Stormer.
The purpose is to make the candles generate the input signal more clearly.
Description:
When the sales PFR candle appears colored, watch out for the next candle. If he breaks the closing of the PFR sell candle, SALE!
Your stop should be at the maximum of the PFR candle and your target projected at 1.618 in the fibonacci extension.
When the buy PFR candle appears colored, watch out for the next candle. If it breaks the closing of the buy PFR candle, BUY!
Your stop should be at the low of the PFR candle and your target projected at 1.618 in the fibonacci extension.
Inside Bar: The candle has its maximum less than the maximum of the previous candle and its minimum greater than the minimum of the previous candle.
Settings:
You can edit the colors in the indicator settings and select the measurements you want to use.
You can also choose to use the Stocastico Lento filter on over-purchase and over-sale.
You can also activate the Inside bar, it will appear in red on the graph.
There is also the possibility to activate in the settings, the Bollinger Bands.
--------------------------
Este box contém duas estratégias, diversas médias móveis e Bandas de Bollinger.
PFR ou "Preço de fechamento de reversão" é uma estratégia simples e eficaz, bastante difundida pelo trader brasileiro Stormer.
O intuito é tornar os candles de geram o sinal de entrada mais claro.
Descrição:
Quando o candle PFR de venda aparecer colorido, fique atento ao próximo candle. Se ele romper o fechamento do candle PFR de venda, VENDA!
Seu stop deverá ser na maxima do candle PFR e seu alvo projetado em 1,618 na extenção de fibonacci.
Quando o candle PFR de compra aparecer colorido, fique atento ao próximo candle. Se ele romper o fechamento do candle PFR de compra, COMPRE!
Seu stop deverá ser na mínima do candle PFR e seu alvo projetado em 1,618 na extenção de fibonacci.
Inside Bar: O candle tem sua máxima menor que a máxima do candle anterior e sua mínima maior que a minima do candle anterior.
Configuração:
Você pode editar as cores nas configurações do indicador e selecione as medias que deseja usar.
Também pode escolher usar o filtro do Stocastico Lento em sobre compra e sobre venda.
Você também pode ativar o Inside bar, ele aparecerá em vermelho no gráfico.
Há também a possibilidade de ativar nas configurações, as Bandas de bollinger.
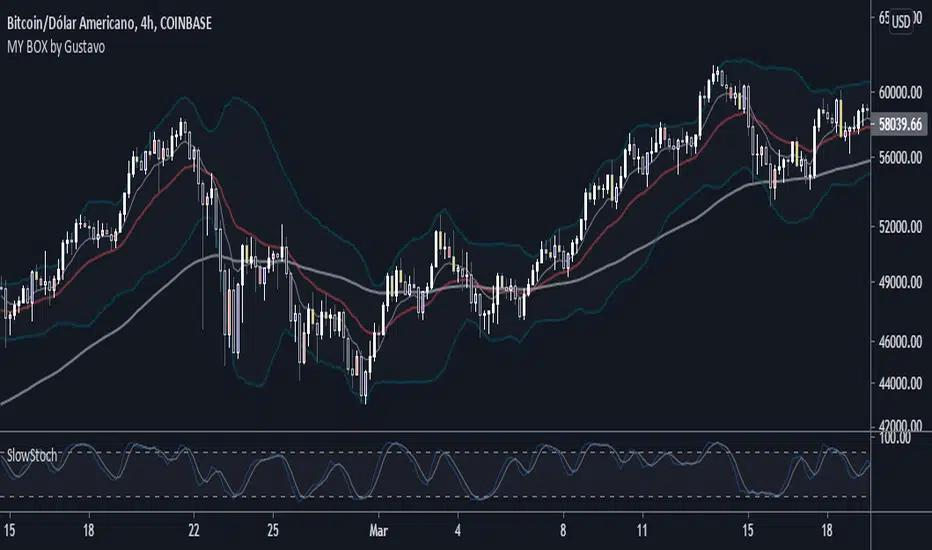
3LL+Baby & 3HH+Baby Pattern3LL+Baby & 3HH+Baby Pattern Indicator
Overview
This indicator identifies powerful reversal patterns based on momentum exhaustion and inside bar formations. It detects two specific candlestick patterns that signal potential trend reversals: the bullish 3LL+Baby and the bearish 3HH+Baby.
Pattern Descriptions
📈 3LL+Baby Pattern (Bullish Reversal)
Conditions:
Three consecutive candles form lower lows (each low is lower than the previous)
The fourth candle is bullish/green (closes higher than it opens)
The fourth candle is completely contained within the third candle's range (both high and low)
Interpretation: After a downward momentum with three lower lows, a bullish inside bar (baby candle) suggests sellers are exhausted and buyers may be taking control. This pattern often precedes upward reversals.
📉 3HH+Baby Pattern (Bearish Reversal)
Conditions:
Three consecutive candles form higher highs (each high is higher than the previous)
The fourth candle is bearish/red (closes lower than it opens)
The fourth candle is completely contained within the third candle's range (both high and low)
Interpretation: After upward momentum with three higher highs, a bearish inside bar indicates buyers are losing strength and sellers may be gaining control. This pattern often signals potential downward reversals.
Features
Visual Signals
Green Triangle (↑): Appears below bars when 3LL+Baby pattern is detected
Red Triangle (↓): Appears above bars when 3HH+Baby pattern is detected
Labels: Clear text labels identifying each pattern type
Background Highlighting: Subtle background colors (green for bullish, red for bearish)
Customization Options
Toggle labels on/off
Toggle arrow signals on/off
Enable/disable bullish patterns independently
Enable/disable bearish patterns independently
How to Use
Add to Chart: Apply the indicator to any timeframe and instrument
Configure Settings: Adjust visibility options based on your preference
Set Alerts: Create alerts for immediate pattern notifications
Trading Strategy:
3LL+Baby : Consider long positions or closing shorts
3HH+Baby: Consider short positions or closing longs
Always confirm with additional analysis and risk management
Best Practices
Use in conjunction with support/resistance levels
Combine with volume analysis for confirmation
Works on all timeframes (higher timeframes generally more reliable)
Apply proper risk management and stop-loss orders
Consider the broader market context and trend

STRAT - MTF Dashboard + FTFC + Reversals v2.7# STRAT Indicator - Complete Description
## Overview
A comprehensive multi-timeframe STRAT trading system indicator that combines market structure analysis, flip levels, Full Timeframe Continuity (FTFC), and reversal pattern detection across 12 timeframes.
## Core Features
### 1. **Multi-Timeframe STRAT Dashboard**
- Displays STRAT combos (1, 2u, 2d, 3) across 12 timeframes: 1m, 5m, 15m, 30m, 1H, 4H, 12H, Daily, Weekly, Monthly, Quarterly, Yearly
- Color-coded directional bias (green/red/doji)
- Inside bars (●) and Outside bars (●) highlighted
- Current timeframe marked with ★
### 2. **HTF Flip Levels with Smart Grouping**
- Displays higher timeframe (HTF) flip levels (open prices) as labels on the right side
- Automatically groups multiple timeframes at the same price level (e.g., "★ 1H/4H/D")
- Current timeframe flip level always displayed with ★ marker
- Color-coded: Green (above price) / Red (below price)
### 3. **Full Timeframe Continuity (FTFC)**
- User-selectable 4 timeframes for FTFC analysis (default: D, W, M, Q)
- Green line: FTFC Up (highest open of 4 timeframes)
- Red line: FTFC Down (lowest open of 4 timeframes)
- Identifies when price is above/below all 4 timeframe opens
### 4. **Hammer & Shooting Star Detection**
- **Hammer Pattern**: Long lower wick (≥2x body), small upper wick, signals potential bottom reversal
- **Shooting Star Pattern**: Long upper wick (≥2x body), small lower wick, signals potential top reversal
- Scans last 100 bars (adjustable) and marks ALL historical patterns
- Chart markers: 🔨 (Hammer) below bars, 🔻 (Shooting Star) above bars
- Dashboard column shows reversal patterns for each timeframe
- Adjustable wick-to-body ratio sensitivity (1.5 to 5.0)
### 5. **Debug Tables**
- **FTFC Debug**: Shows close vs. 4 timeframe opens, confirms all-green/all-red conditions
- **Reversal Debug**: Real-time analysis of current bar - body size, wick measurements, ratios, and pattern qualification
## Settings
### Display Settings
- Dashboard position (9 options: top-left to bottom-right)
- Dashboard text size (tiny to huge)
- Label offset and text size
- Toggle individual features on/off
### FTFC Settings
- Select 4 custom timeframes for continuity analysis
- Default: Daily, Weekly, Monthly, Quarterly
### Reversal Settings
- **Wick to Body Ratio**: Sensitivity for pattern detection (default 2.0)
- **Lookback Bars**: How many historical bars to scan (default 100, max 500)
- Show/hide reversal markers on chart
- Show/hide reversal debug table
## Use Cases
1. **Momentum Trading**: Identify STRAT setups (2-2, 2-1-2 reversals, 3-bar plays) across multiple timeframes
2. **Swing Trading**: Use HTF flip levels as support/resistance and FTFC for trend confirmation
3. **Reversal Trading**: Catch hammer/shooting star patterns at key levels for counter-trend entries
4. **Multi-Timeframe Analysis**: Confirm alignment across timeframes before entering trades
## How to Use
### For STRAT Traders
- Look for 2-1-2 reversal setups in the dashboard
- Watch for inside bars (●) at HTF flip levels for breakout trades
- Use outside bars (●) to identify potential volatility expansion
### For Reversal Traders
- 🔨 Hammers after downtrends = potential long entries
- 🔻 Shooting stars after uptrends = potential short entries
- Combine with HTF flip levels for high-probability setups
### For Trend Followers
- FTFC green line above = bullish structure
- FTFC red line below = bearish structure
- Enter when price breaks and holds above/below FTFC levels
## Visual Elements
- **Green Labels**: HTF flip levels above current price (resistance)
- **Red Labels**: HTF flip levels below current price (support)
- **Lime Line**: FTFC Up (highest timeframe open)
- **Red Line**: FTFC Down (lowest timeframe open)
- **🔨 Icon**: Hammer pattern (potential reversal up)
- **🔻 Icon**: Shooting Star pattern (potential reversal down)
- **★ Symbol**: Current timeframe or multiple timeframes grouped
## Performance Notes
This indicator performs 12 multi-timeframe security calls and may take 15-30 seconds to calculate on initial load. This is normal for comprehensive MTF analysis.
## Version
v2.7 - Simplified reversal detection, current TF labeling, optimized performance
---
**Perfect for**: STRAT traders, multi-timeframe analysts, reversal pattern traders, swing traders looking for high-probability setups with confluence across timeframes.
